Thermoptim Process Diagrams
In addition to its classic diagrams, Thermoptim allows the creation of process flow diagrams. Their goal is to provide a clearer presentation, especially for models involving a large number of components.
The new diagrams can be easily modified due to their encoding according to the SVG standard, which additionally allows for vector drawings, meaning their size can be changed without loss of sharpness. They can be customized at will using free editors like Inkscape, which allow for easy editing.
The emphasis is placed more on fluid networks than on individual components, whose size is reduced, and connection ports no longer appear. This increases readability and allows for the grouping of elements by adding various shapes.
These new diagrams resemble the process diagrams or flowsheets used in process engineering.
For the SVG diagram to be generated correctly, all elements of the simulator must have their counterparts in the Thermoptim diagram, which can be verified and corrected thanks to the interface between these two working environments.
This page presents these process diagrams and shows how to edit them with Inkscape.
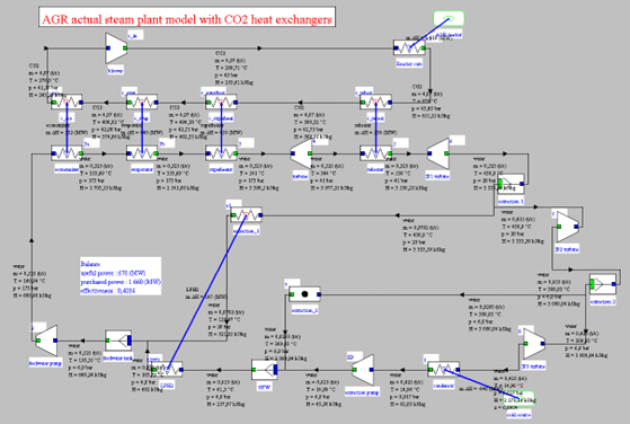
Comparison of the process diagram and the Thermoptim synoptic view
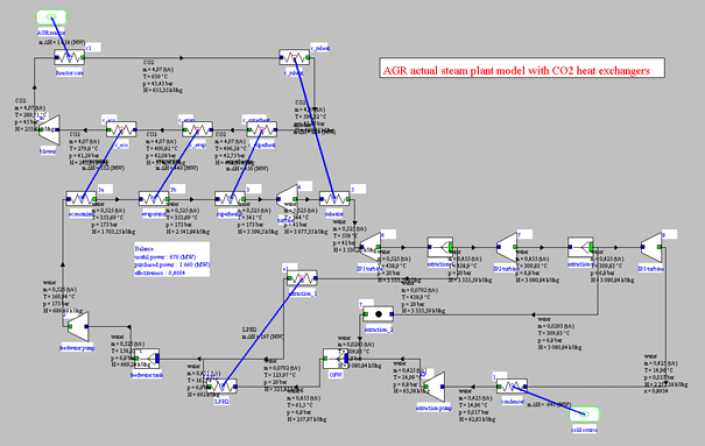
The Figure below shows the usual Thermoptim synoptic view of a model of the Torness nuclear power plant in Scotland, of the AGR (Advanced Gas Reactor) type.
The generated process diagram is shown in the Figure below
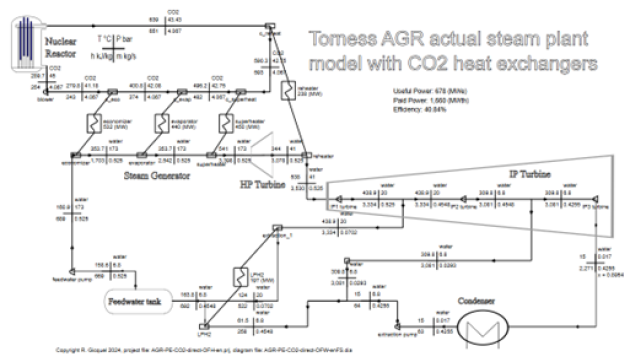
As in the synoptic view, the thermodynamic state of the different points is displayed throughout the fluid network.
The main differences arise from the figurative elements that appear on the new diagram:
the nuclear reactor at the top left,
the feedwater tank at the bottom left,
the condenser at the bottom right,
and especially the intermediate pressure turbine "IP turbine," represented by an element superimposed on the three turbine units of the Thermoptim model, which shows that it is actually a single machine.
Different Steps for Generating the Process Diagram
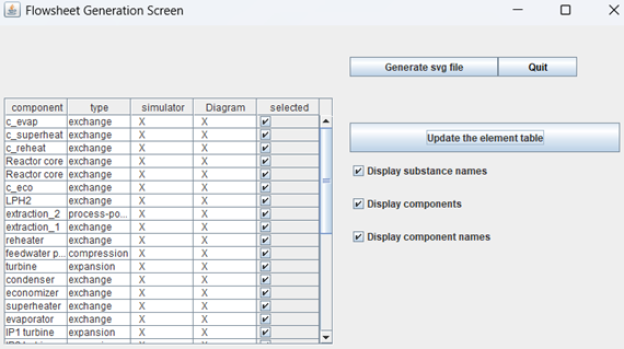
The screen in the Figure below allows for managing the generation of the SVG file
Lorsque l'on clique sur « Mettre à jour la table des éléments », l'ensemble des composants présents dans le simulateur et dans l'éditeur de schémas est analysé. Si les deux ensembles ne sont pas cohérents, un message informe l'utilisateur, qui doit revoir son modèle. L'interface Schéma / Simulateur lui offre différents outils pour lui faciliter la tâche.
Si aucun message n'est affiché, la génération peut commencer. Comme le montre cette figure, on peut choisir d'afficher ou non les noms des corps mis en jeu, les symboles des composants et leurs noms.
Le fichier généré se trouve dans le dossier « svg » du répertoire d'installation de Thermoptim. Par défaut il s'appelle « flowsheet.svg ». Si un fichier de ce nom existe, il vous est proposé de le sauver sous un autre nom.
Afin que vous puissiez retrouver facilement à quel projet de Thermoptim correspond ce schéma, les noms des fichiers de projet et de schéma ainsi que la date sont indiqués dans la partie haute.
When you click on "Update the element table," all components present in the simulator and in the diagram editor are analyzed. If the two sets are not consistent, a message informs the user, who must review their model. The Schema/Simulator interface provides various tools to facilitate this task.
If no message is displayed, the generation can begin. As shown in this Figure, you can choose to display or not display the names of the substances used, the symbols of the components, and their names.
The generated file is located in the "svg" folder of the Thermoptim installation directory. By default, it is called "flowsheet.svg". If a file with this name exists, you are offered to save it under a different name.
The Figure below shows, for the presented model and the layout of the diagram in Figure 1, the initially obtained generation. This SVG file is easily displayed in browsers such as Edge, Chrome, or Firefox.
To make it easy for you to find which Thermoptim project this diagram corresponds to, the names of the project and diagram files as well as the date are indicated at the top.
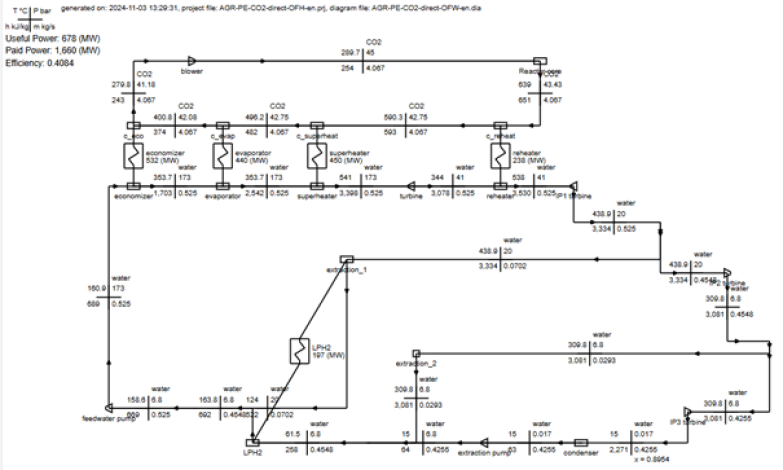
The generation is good, but the three units of the IP turbine are not aligned, making it difficult to display them as in the above flowsheet. Additionally, the connection between the nuclear reactor and the reheater is routed downwards, whereas the component intended to illustrate this reactor has an input at the bottom and an output at the top.
To modify the SVG file, simply adjust the placement of the components in the synoptic view and regenerate. Refreshing the browser in which it is displayed updates the drawing.
Ultimately, the satisfactory layout shown above is obtained.
Customization of the generated file
The figure below shows the SVG file generated for the Torness power station, before customization. It is a text file of 630 lines, which could be edited by hand, but it would be quite laborious.
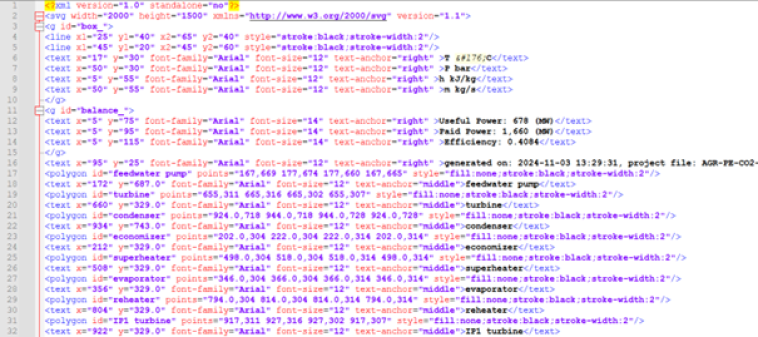
The freely available software Inkscape allows you to modify this file. It is a very powerful environment, and knowing just a few basic commands can yield quite satisfactory results.
Once the file is opened, you can select an element by clicking on it (Figure below).
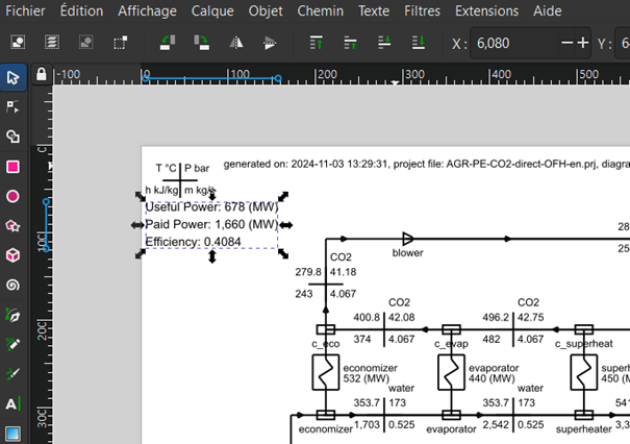
You can then drag the mouse to the desired final location.
An important note is that the different elements of the diagram can be grouped or ungrouped. In this case, the three text areas were grouped during generation. If you want to access one of them, you must ungroup them, which can be done using the Object/Ungroup menu item. Once the texts are modified as desired, you can regroup them (Object/Group menu item) to manipulate them together.
You can also modify the lines that connect the different components, changing their lengths, thicknesses, colors, etc.
To add the element representing the IP turbine, you can either create it from scratch, which can be laborious, or copy it from another SVG file and paste it into this one, then move and resize it, flip it horizontally if necessary, etc.
This is how the schematics of the nuclear reactor, the feed tank, and the condenser were imported. In all three cases, the dimensions of the links leading to them were modified graphically to obtain the process diagram shown above.
This file is available at this adress.
Note that if you want to generate several diagrams corresponding to the same Thermoptim diagram but with several parameters, you should generate a common template without the thermodynamic values and save it as is. Then you just generate the thermodynamic values, then open that setup file with Inkscape, select the set, copy them, and then open the frame and paste the values. You will have to drag the values to the right place but this is not very difficult. Finally you save the new diagram under a different name from the one of the template so that the latter can be used again.
